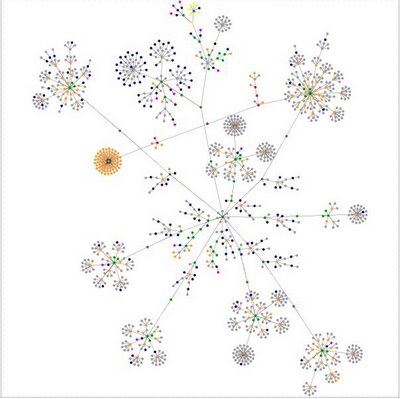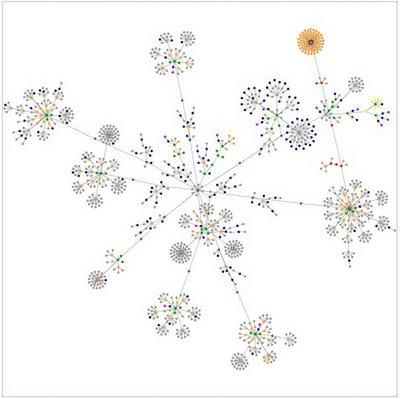

(click for larger)
Those nifty little pics above are graphic representations of this blog. I’m not exactly sure what it all means, other than the fact I use a lot of block quotes and include a lot of links. The one intense cluster of orange (block quotes) has me amazed and mystified...
What do the colors mean?
blue: for links (the A tag)
red: for tables (TABLE, TR and TD tags)
green: for the DIV tag
violet: for images (the IMG tag)
yellow: for forms (FORM, INPUT, TEXTAREA, SELECT and OPTION tags)
orange: for linebreaks and blockquotes (BR, P, and BLOCKQUOTE tags)
black: the HTML tag, the root node
gray: all other tags
Want to graph your blog (or other site)? Go here. Be advised: it took about ten minutes to graph EIP. I think it’s worth the wait. And you get slightly different graph picture if you run the applet a second time, as you can tell from the pics. (h/t: Castle of Nannbugg)


.jpg)


This was interesting. At first I thought it was needlepoint...LOL! I started doing mine but didn't wait for it all to finish. Too tired this week! Working 11 hour days this week.
ReplyDeleteOh, and I had a similar orange cluster. My theory was that represents the sidebar.
ReplyDelete11-hour days... I have strong memories of that...uh..."experience." And I didn't like it a BIT. But sometimes ya gotta do it; hang in there, Laurie!
ReplyDeleteThe "sidebar theory" is as good as any; I can't come up with a better explanation!